
Gym Marketing
Marketing content for gym and studio owners—local SEO, advertising, email and social, referrals, and turning leads into members.
Imagine it's 7pm, the kids' class just bowed out, and you're still on the mat helping a white belt find his other sock.
Meanwhile, a mom has filled out the form on your website. She wants to know if her eight-year-old can try a class.
By the time you get to your phone, she's booked a trial at the school down the road. They texted back in four minutes.
A martial arts CRM is there so she hears from you first.
I work at Gymdesk, so you should know where I'm sitting. I lined up eight martial arts CRMs, Gymdesk included, against the same six tests. Every price came off the vendor's own pricing page on October 19, 2026.
Where another tool is the better pick, I'll say so.
THE SHORT VERSION:
If you run a kids program and want leads, trials, texting, and belts in one system, test Gymdesk and Spark Membership first. Spark charges one flat price. Gymdesk costs less than Spark until you pass 150 active students, and it shows which lead source turned into paying students. On a tight budget, Black Belt CRM and Martialytics are the cheapest at 60 and 180 students (leaving out $0 plans paid for through processing), but neither advertises two-way texting with leads.
What a Martial Arts CRM Actually Has to Do
A martial arts CRM is the part of your school software that captures new leads, follows up with them automatically, books their trial, and turns them into paying students. The gym CRM software comparison covers the general version.
Here's where a martial arts lead differs from a gym lead:
- The buyer is often a parent. The person filling out the form isn't the one who'll be on the mat, and your CRM has to hold both.
- The trial belongs to a program. A kids intro and an adult BJJ trial need different follow-up and often different prices.
- The retention signal is the next belt. Watch for the kid whose attendance drops two months before a stripe test.
Joe Guarino of Unlimited BJJ ran into this before he picked his software:
"I think software is built for the fitness industry, but it's not built for martial arts. I think, after looking at the different products, the ones that were really specific to jujitsu, they were lacking in some more generalized features like lead tracking and things like that."
Generic tools don't know what a belt is, and the belt tools forget about leads. Every tool below tries to do both.
Running a BJJ academy? The BJJ gym software comparison goes deeper on stripes and grappling programs.
The Six Tests
This post sticks to leads, trials, and follow-up. For the whole platform, see the martial arts management software comparison.
Here's what I checked for each tool:
- The parent-and-child lead. Can one inquiry hold a parent and a child and become a family account at sign-up?
- Speed to lead. Does a new lead get an automatic reply within minutes, and can you text back and forth? (The speed to lead post explains why minutes matter.)
- Trial to member, per program. Can kids and adult trials run different follow-up and convert to a membership without retyping?
- Follow-up that knows rank and attendance. Can automations fire on an absence or a promotion?
- Source to paying member. Can you see which channel produced paying students?
- The price model. Per-student bands, a flat fee, or "free" software paid for through processing fees?
GOOD TO KNOW:
"Not listed" isn't "no." Vendors don't advertise everything. If a "Not listed" cell matters to you, ask in the demo.
Martial Arts CRM Software at a Glance
Here's how the eight tools line up where they compare cleanly. Prices are each vendor's lowest published monthly price.
Tool | Price model | Starting price | Family accounts | Two-way SMS | Rank or attendance follow-up | Free trial or plan |
Gymdesk | Active-member bands | $75/mo | Yes (guardian fields) | Yes (usage-based) | Yes (promotion and absence triggers) | 30-day trial |
Spark Membership | Flat fee | $199/mo | Yes | Yes (texts use credits) | Attendance and trial follow-up | Eight-week trial |
Kicksite | Active-student bands | $49/mo | Family profiles | Yes | Not listed | Free trial |
Martialytics | Active-student bands | $69/mo | Not listed | Not listed | Absence only | 30-day trial |
Black Belt CRM | Member bands | $39/mo | Yes (households) | Add-on, per message | No automated follow-up | 30-day trial |
Market Muscles | Software fee plus processing | $0/mo | Family grouping | Yes | Yes (rank and attendance segments) | Free plan |
Zen Planner | "Starting at," by module | $99/mo | Not listed | Yes (with Engage) | Yes (with Engage) | Demo |
PushPress | Free plan plus paid tiers | $0/mo | Not listed | Via Grow | Not listed | Free plan |
Prices and features from each vendor's own website, October 19, 2026. Re-check before you buy; pricing pages change.
The 8 Martial Arts CRMs, Compared
These aren't ranked.
Gymdesk goes first because it's the one I know best, and the rest follow in the order I looked at them.
Gymdesk

Gymdesk is school management software for independent martial arts schools and gyms, with the CRM built in.
A parent fills out your kids trial form and gets an automatic text and email. When the trial ends, it converts to the membership you set. Then an absence automation catches the student if attendance drops before their first stripe.
What's under the hood:
- Lead management. Lead stages you can add to, fed by website forms, bookings, imports, and Zapier, with a spam filter.
- Two-way texting. Text, email, and push from the lead's profile.
- Marketing automations. There are 19 triggers, including new lead, absence, and promotion, and bulk messages can target students by rank and program.
- Family accounts. Guardian fields let one parent manage and pay for three kids.
- A lead-to-member report. Filter it by program and lead source.
- Belt and rank tracking. Stripes and dated history across programs.
- Smoothcomp tournaments. Gymdesk and Smoothcomp are now one company, so tournament registration and results live on the student's record.
Martin Herrick runs Adayama Jiu-Jitsu around a full-time job, which makes speed to lead hard to do by hand:
Price: $75 a month for up to 50 active members on Gymdesk Payments, or $100 with your own processor. Your website is included.
The catch: lead conversations live in the web app, with no staff phone app built around them.
Texting also needs a number. In the US, that means a carrier registration that Gymdesk walks you through, with small setup fees and a monthly campaign fee passed through at cost. Messages are billed by usage.
The founder trained BJJ for close to a decade before building it, if that sways you. Here's why Gymdesk was built.
Best for: kids-heavy schools wanting leads, trials, belts, and a website in one plan.
Spark Membership
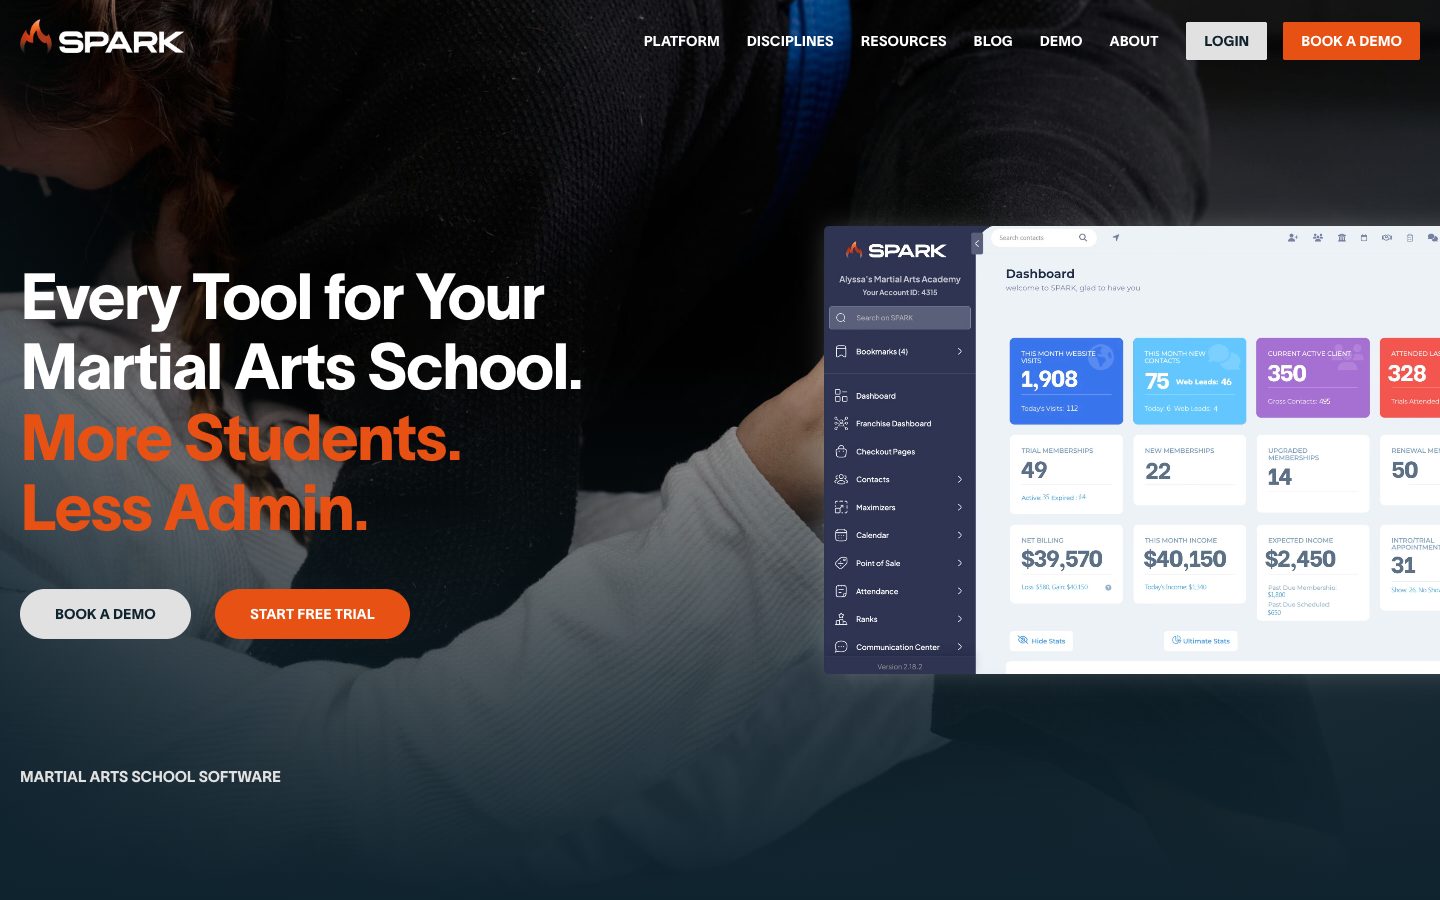
Spark Membership is martial arts software built around lead follow-up and marketing.
Its CRM page says it keeps prospects, trials, members, and lapsed students in one profile with belt rank, attendance, billing, and family accounts. When a trial goes quiet after the first session, an automated follow-up fires.
Its texting page adds that when attendance slips, a re-engagement text goes out. Texting is two-way, and messages through the Spark Member App are free.
Spark is the only vendor here that pitches its staff app as a way to run the whole school from your phone, and it says the app is included.
Price: $199 a month, flat, after an eight-week free trial, with free data migration.
Watch for: texts to anyone without the Spark app cost credits, and the flat price assumes you process payments through Spark.
In the US and Canada, its help center says a school with its own merchant logs payments by hand. That school also loses auto-charge, checkout pages, and point-of-sale payments.
Ask them: can reporting follow a lead source to a paying member?
Weighing a move? Here's what switching from Spark involves.
Best for: owners whose front desk lives on a phone.
Kicksite

Kicksite has served martial arts schools for close to two decades.
Leads come in through embedded forms, landing pages, QR codes, and a tablet kiosk for walk-ins. Leads move through a drag-and-drop board with custom stages and Hot, Warm, or Cold labels, and members get student and family profiles.
Automations send emails and texts the moment a form comes in. Its lead management page also lists two-way texting with alerts on new conversations.
Its homepage says texting is free and unlimited, which is rare in this group.
Price: priced by active students, from $49 a month for up to 25, on Kicksite's pricing page. Kicksite says every feature is included at every tier. Payments run through its preferred partner, Basys.
Ask them: can follow-up fire on rank or promotion, and can reporting follow a lead to a paying member? Its pages don't say.
Best for: small schools that want texting included.
Martialytics

Martialytics has one pricing detail that matters for a CRM.
Leads and inactive students are free. You only pay for active students, so a school with 400 old inquiries in the system doesn't get billed for them, even the ones from kids who are in college now.
Its features page lists one-touch sign-ups with automations, automatic absence follow-up, grading readiness tracking, push notifications, mass messaging, and unlimited emails.
Price: $69 a month for up to 50 active students. Every plan gets every feature.
Watch for: two-way texting with leads, parent-and-child leads, and source-to-member reporting aren't listed on its site. Ask about all three.
Best for: big lead lists on a tight budget.
Black Belt CRM

Black Belt CRM publishes the cheapest paid entry price in this group ($39), and it's upfront about what it doesn't do.
Its family setup is the strongest on paper. One household can hold several adults with different roles, a separate card for each, and release authorizations for pickup.
For leads, it tracks enquiries, trials, and expired trials as real statuses, with a source, an owner, and a follow-up date.
But its own leads and trials page says plainly that it doesn't run automated nurture sequences or no-show workflows. I appreciate the candor. Most vendors would bury that.
Price: priced by active and suspended members, from $39 a month for up to 25, on its pricing page.
The catch: text messaging is an optional add-on, priced per message and never included in a plan. Follow-up is manual.
Best for: budget schools with complex families and time to follow up by hand.
Market Muscles

Market Muscles pairs a school CRM with a marketing website service.
The CRM side has a drag-and-drop lead board, workflows that email or text leads based on what they do, and one-to-one text threads. You can build lists by rank, attendance, lead source, and program.
It also advertises AI voice and chat bots that it says qualify and follow up with leads around the clock. That's its claim, from its own site.
Price: Flex is $0 a month with processing at 3.9% + 30¢, and Scale is $159 a month with processing at 2.9% + 30¢, per its pricing page.
The catch: Flex is software paid for through processing, and that math changes as you grow.
Ask them: does a trial convert to a paid membership automatically?
Best for: one company for your website and CRM.
Zen Planner

Zen Planner is a multi-program platform whose martial arts pages cover belt tracking with promotion eligibility notifications.
The CRM lives in a separate product called Engage. Zen Planner says Engage captures leads from web forms, social media, and walk-ins, and runs two-way texting and online trial booking. It also sends missed-class texts and promotion reminders.
Under the Engage AI name, Zen Planner sells what it calls conversational AI for texts and web chats.
Price: "starting at" prices, charged only for active members, on Zen Planner's pricing page. Studio starts at $99 a month, and Engage starts at $249 a month on top. Ultimate, which bundles a website with advanced marketing automation and CRM, starts at $348.
Ask them: what will Studio plus Engage cost at your student count? With "starting at" pricing, your real number takes a demo.
If you're comparing the two directly, here's Gymdesk vs Zen Planner.
Best for: buying the CRM as a separate module.
PushPress
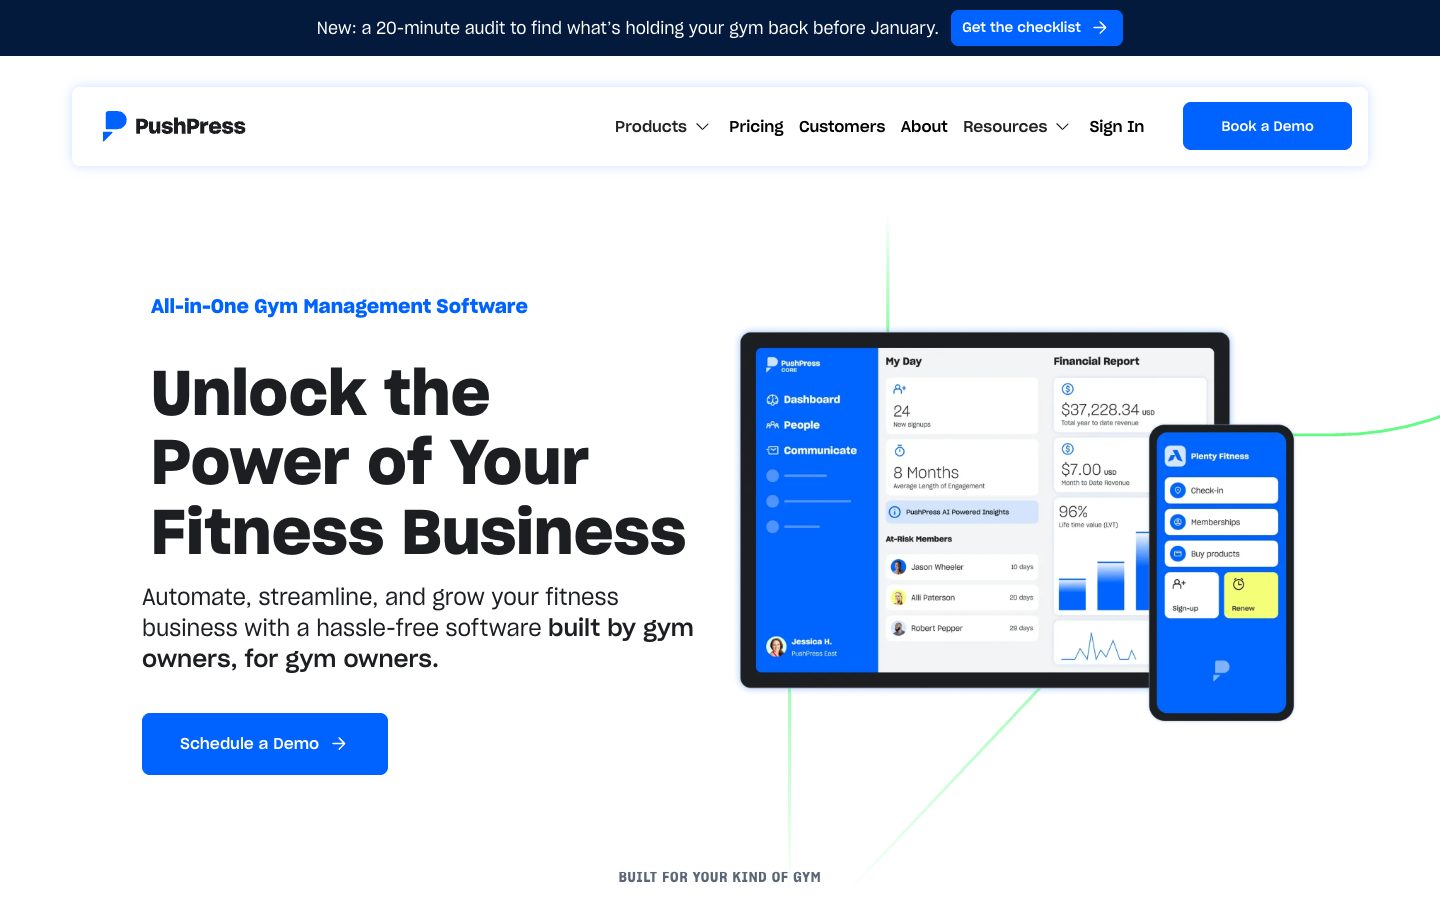
PushPress is gym software with a martial arts page that says it's built for BJJ, MMA, boxing, Muay Thai, karate, and Taekwondo schools. That's a lot of ways to get hit on one page.
Parents can sign digital waivers for minors, but parent-and-child leads aren't listed. Belt and stripe tracking with promotion criteria comes with the Pro and Max plans.
Automated follow-up for leads and trials sits in a product called Grow. Its martial arts page says Grow texts trial leads back at night and on weekends.
Price: the Free plan is $0, with card processing at 4.99% + 30¢, on PushPress's pricing page. Pro is $159 a month and Max is $229, per location.
The catch: belt tracking isn't on the free plan, and Grow costs $329 a month extra on every plan. Want both? That's Pro plus Grow.
Comparing the two? Here's PushPress vs Gymdesk for martial arts schools.
Best for: new schools starting free and adding pieces later.
What a Martial Arts CRM Costs at 60 and 180 Students
What matters is the monthly bill at your student count, and whether a "free" plan is being paid for in processing fees.
Free CRM software is a lot like a free puppy. The bills show up later, one payment at a time.
The bottom line: leaving out the $0 plans, Black Belt CRM and Martialytics are the cheapest at both sizes, and Zen Planner and PushPress cost the most once you add their CRM module.
Here's the published bill at 60 and 180 active students:
Tool | Price model | 60 students | 180 students | Note |
Gymdesk | Active-member bands | $100 ($125 own processor) | $200 ($240 own processor) | Website included; branded app $100/mo extra; extra locations $50/mo ($100 own processor) |
Spark Membership | Flat | $199 | $199 | Student cap not stated; texts to non-app users use credits |
Kicksite | Active-student bands | $149 | $199 | All features at every tier, per Kicksite |
Martialytics | Active-student bands | $99 | $129 | Leads and inactive students free |
Black Belt CRM | Member bands | $59 | $85 | Counts active and suspended members; texting extra |
Market Muscles | Software fee plus processing | $0 or $159 | $0 or $159 | Processing rate depends on plan; website plan $329 |
Zen Planner | "Starting at," by module | From $99; from $348 with Engage | From $99; from $348 with Engage | Studio $99 + Engage $249, or Ultimate from $348; quote needs a demo |
PushPress | Free plan plus paid tiers | $159 (Pro); $488 with Grow | $159 (Pro); $488 with Grow | Pro $159 + Grow $329; belt tracking needs Pro |
Prices from each vendor's own pricing page, October 19, 2026. Processing fees not included.
HOW "FREE" CRM SOFTWARE GETS PAID FOR:
A $0 plan usually means the vendor earns a higher processing fee on every payment you collect. On Market Muscles' published rates, Flex costs one percentage point more per payment than Scale, and Scale costs $159 a month. So Flex stays cheaper until you collect roughly $16,000 a month. PushPress Free runs on the same model. Run that math with yours.
So where does Gymdesk land? In the middle at 60 students.
At 180, its $200 base (on Gymdesk Payments) is the highest base price in the table, about level with Kicksite and Spark at $199. Zen Planner and PushPress still cost more once their CRM module is added.
On Gymdesk, the website, automations, family accounts, and belt tracking are in the plan. The real add-ons are usage-based texting, the branded app, door access, and extra locations.
The plan also costs less on Gymdesk Payments, and you can still bring Stripe, Square, Authorize.net, or GoCardless.
See the full Gymdesk pricing, or run your own numbers through the software cost calculator.
FREE TOOL
Put in your active members and the payments you collect each month. The calculator adds software and processing side by side for 11 platforms, including Gymdesk, Kicksite, Zen Planner, and PushPress.
RUN YOUR NUMBERSWhich Martial Arts CRM Fits Your School
There's no single right answer, and anyone who says otherwise is selling something. (Yes, I see the irony.)
Start with the type of school you run:
- Kids-heavy, and most leads are parents. Gymdesk, Spark, and Black Belt CRM are strongest on families.
- Under 50 students and watching every dollar. Black Belt CRM, Martialytics, and Kicksite's smallest tier publish the lowest paid prices. Check what texting costs on each before you sign.
- Leads, trials, belts, and a website in one plan, with texting billed by usage. Gymdesk.
- Nothing monthly, and higher processing is fine. Market Muscles' Flex plan and PushPress Free are built for that.
- Karate, Taekwondo, or a traditional dojo. Any karate CRM on your shortlist should pass the rank test. Gymdesk, Spark, Market Muscles, and Zen Planner (with Engage) list follow-up or targeting by rank.
Patrick Teruel of NEO Martial Arts put his own checklist this way:
"I know what's coming in, what's coming out. And I know how to rank people. And I know how to make notes on their file. And I know how to convert leads into members. I'm good. Everything else is gravy."
Test the CRM on a Real Lead Before You Decide
Every tool here has a free trial, a free plan, or a demo. Use it like a parent would.
On each tool you're serious about:
- Submit a kids trial form on your own test site, under a fake name.
- Time how long it takes to get a reply.
- Convert that lead into a family membership.
- Set up one absence follow-up and see whether it fires.
The tool that does all four without a support ticket is the one to keep.
To run that test on Gymdesk, the martial arts software comes with a 30-day free trial, no credit card required. Less admin, more members, zero guesswork.